This is the site you’re looking at. It started as a Hugo portfolio deployed to DMZ nginx containers via GitLab CI and AWX. Then I added a status page that shows the VPN mesh in real-time. Then I added the ability to kill tunnels from the browser. Then I added a log terminal that streams syslog from the firewalls while you watch. It kept going.
Try it on the status page – click tunnel edges on the graph, hit Kill, and watch what happens.
The Status Page
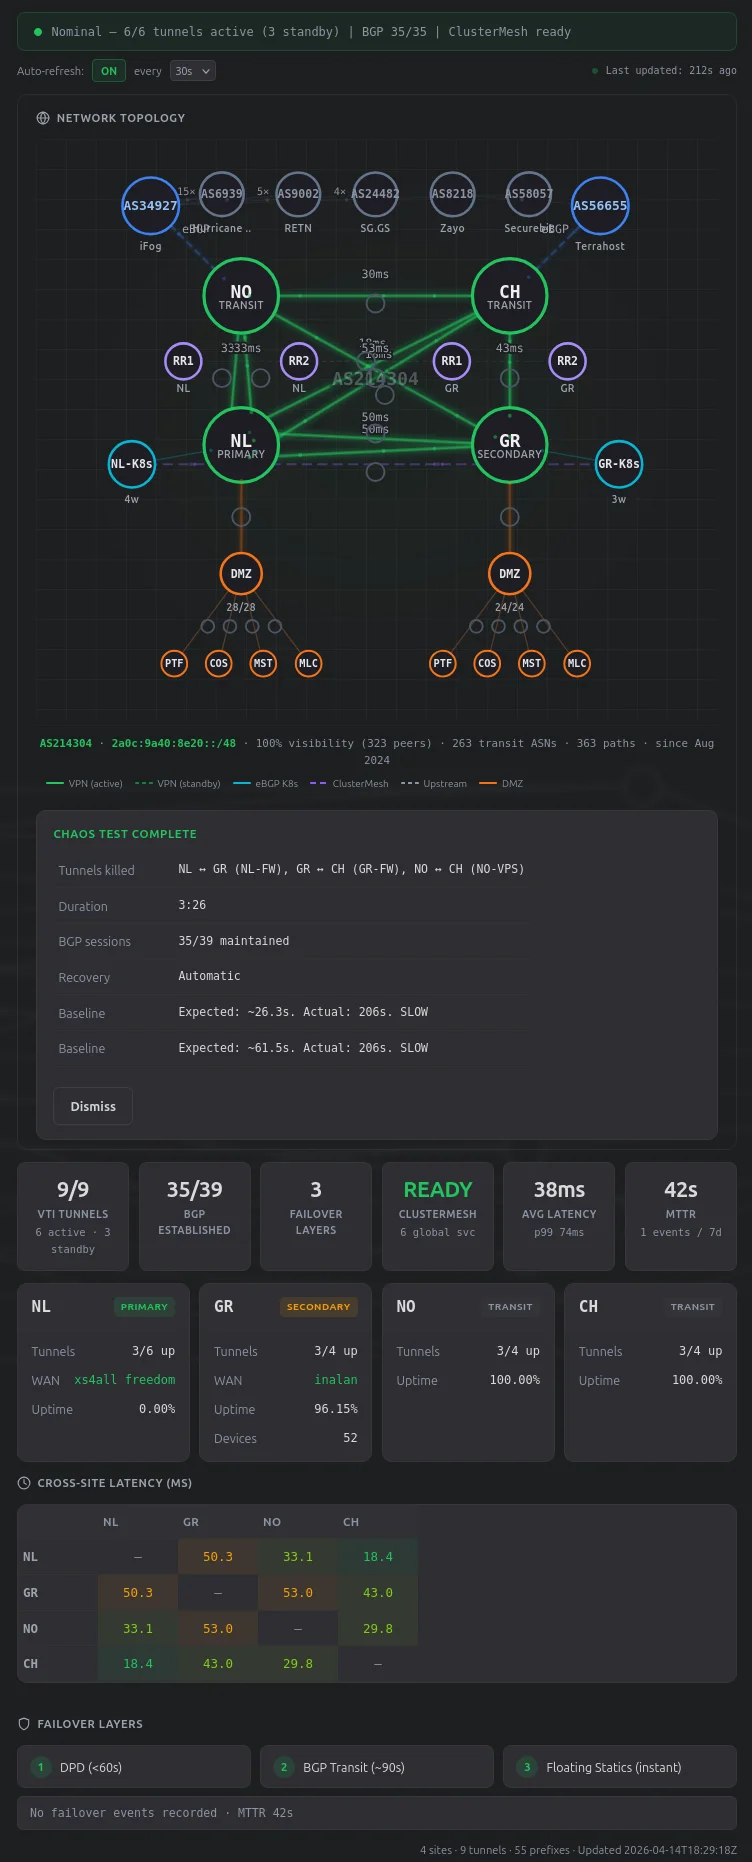
The status page renders a D3 force-directed graph of the VPN mesh: 5 sites (NL, GR, NO, CH, TX — Houston added 2026-05-06), 27 IPsec/VTI tunnels, 4 DMZ hosts with their containers, BGP peering state, and cross-site latency. The data comes from live SSH probes to the actual network devices – ASA firewalls, strongSwan VPS nodes, Proxmox hypervisors – refreshed every 30 seconds. The compound status banner (Nominal/Degraded/Critical) is never baked by CI; it always comes from the live API.
Killing Tunnels
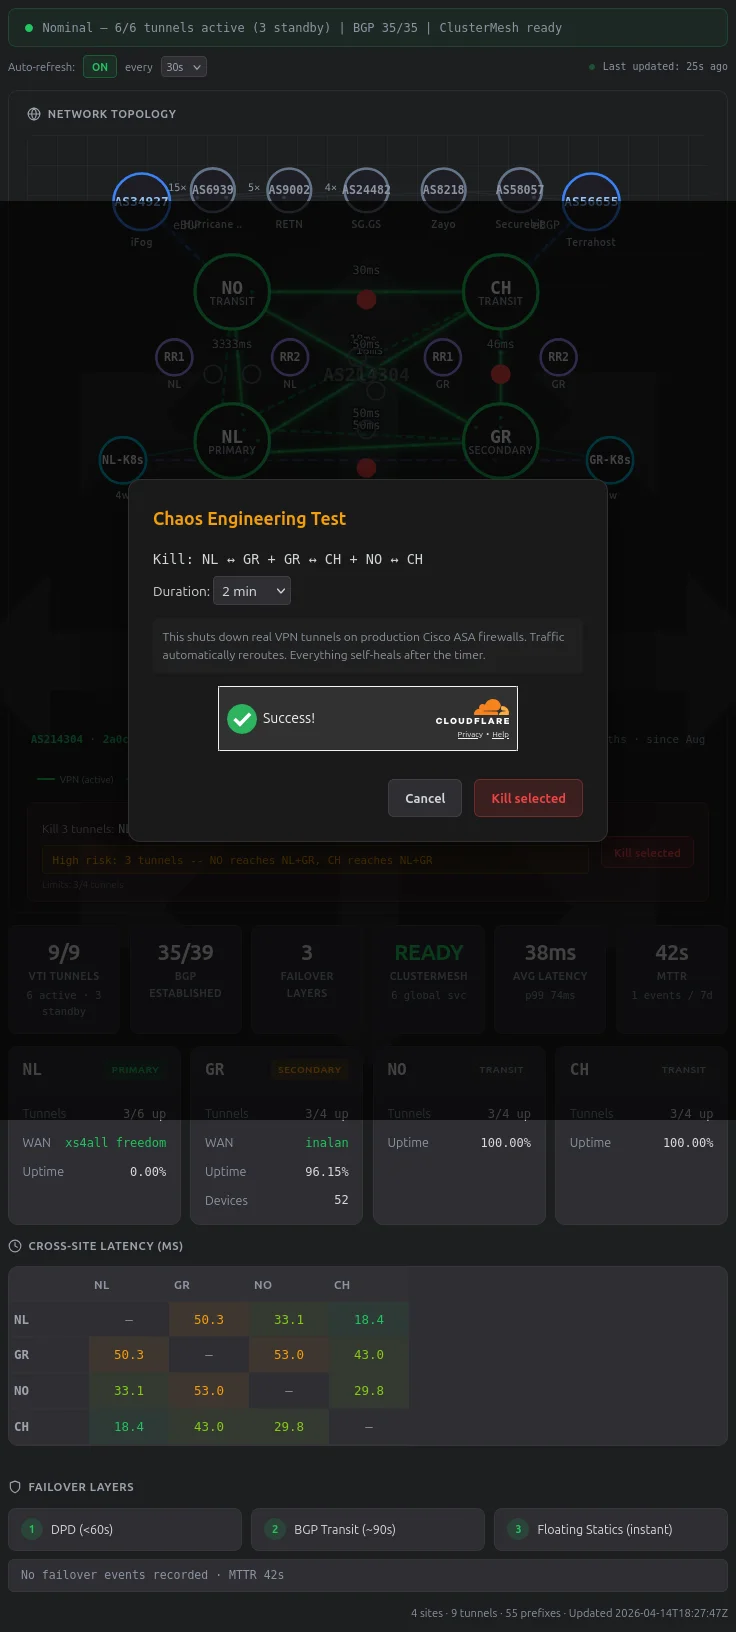
Visitors can select up to 4 tunnel edges on the graph and kill them. This runs interface TunnelX / shutdown on production Cisco ASA 5508-X firewalls via pexpect SSH, or swanctl --terminate --ike on the VPS strongSwan nodes. Real traffic reroutes via BGP transit. Everything self-heals after the timer.
A confirmation modal with Cloudflare Turnstile verification stands between clicking Kill and actually shutting down tunnels.
The safety validator runs BFS on a graph model of the mesh (5 nodes, 8 edges, with NO-CH as the inter-VPS transit backbone). With the per-test cap of 4 simultaneous kills, that’s 162 valid kill combinations: 127 are safe – meaning all three VPS nodes (NO, CH, TX) can still reach at least one DMZ site (NL or GR). The validator blocks the 35 combinations that would isolate a VPS completely. The hardest tests are 4-tunnel kills that leave only one path alive; 44 of those survive the BFS check, and everything funnels through that single edge while the rest of the mesh is down.
There’s a rate limit (1 test per hour for public visitors), Turnstile bot protection, a dead-man switch that auto-recovers after the timer, and a per-minute watchdog cron that catches the case where the dead-man process dies. Alert suppression runs 3 layers deep (Alertmanager silences, LibreNMS maintenance mode, n8n receiver filters) so the chaos test doesn’t page anyone.
The Log Terminal
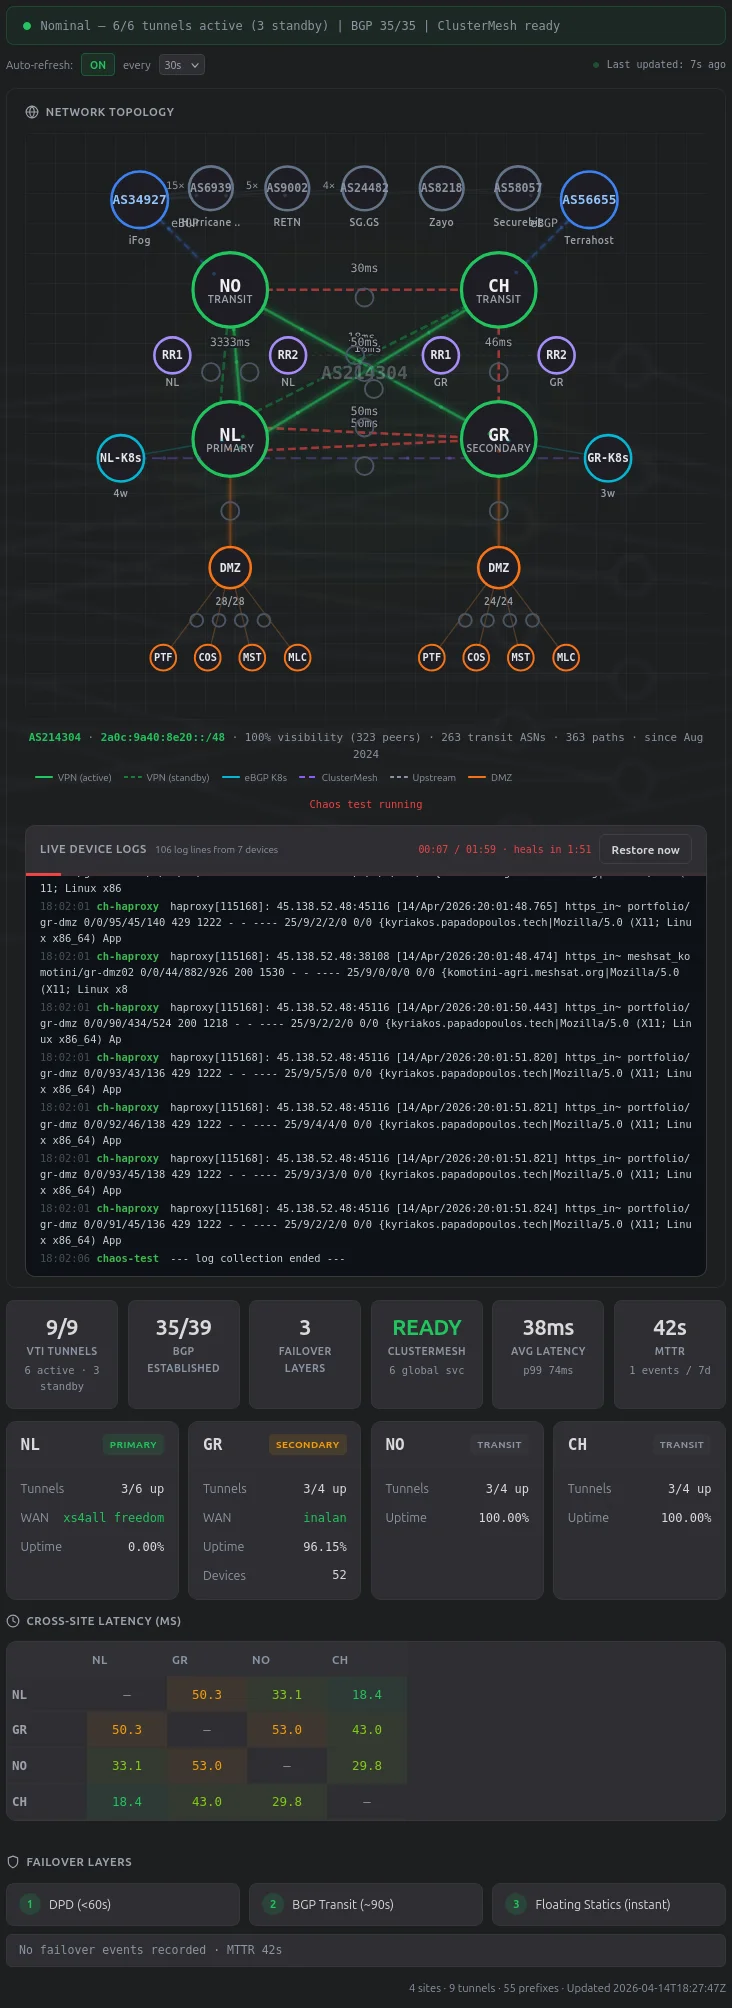
During a test, a terminal panel streams real device logs from the infrastructure. A background process polls 10+ devices every 5 seconds via SSH and writes to a JSONL file that the status API returns inline:
- ASA syslog from both firewalls (nllei01syslogng01, grskg01syslogng01) – tunnel shutdown events, denied TCP from stale connections, IKE renegotiation
- HAProxy journal from both VPS – backend DOWN/UP transitions, failover from primary to backup DMZ
- strongSwan charon from both VPS – IKE_SA and CHILD_SA lifecycle events
- FRR BGP from both VPS – peer state changes as routes reconverge
- Proxmox journal from both PVE hosts –
qm setNIC disconnect commands for DMZ kills
The logs come through the chaos-status API (the same endpoint that drives the countdown timer), not a separate logs endpoint. This matters because during a DMZ kill, the separate logs API path goes through the killed DMZ’s nginx proxy and breaks.
How It’s Built
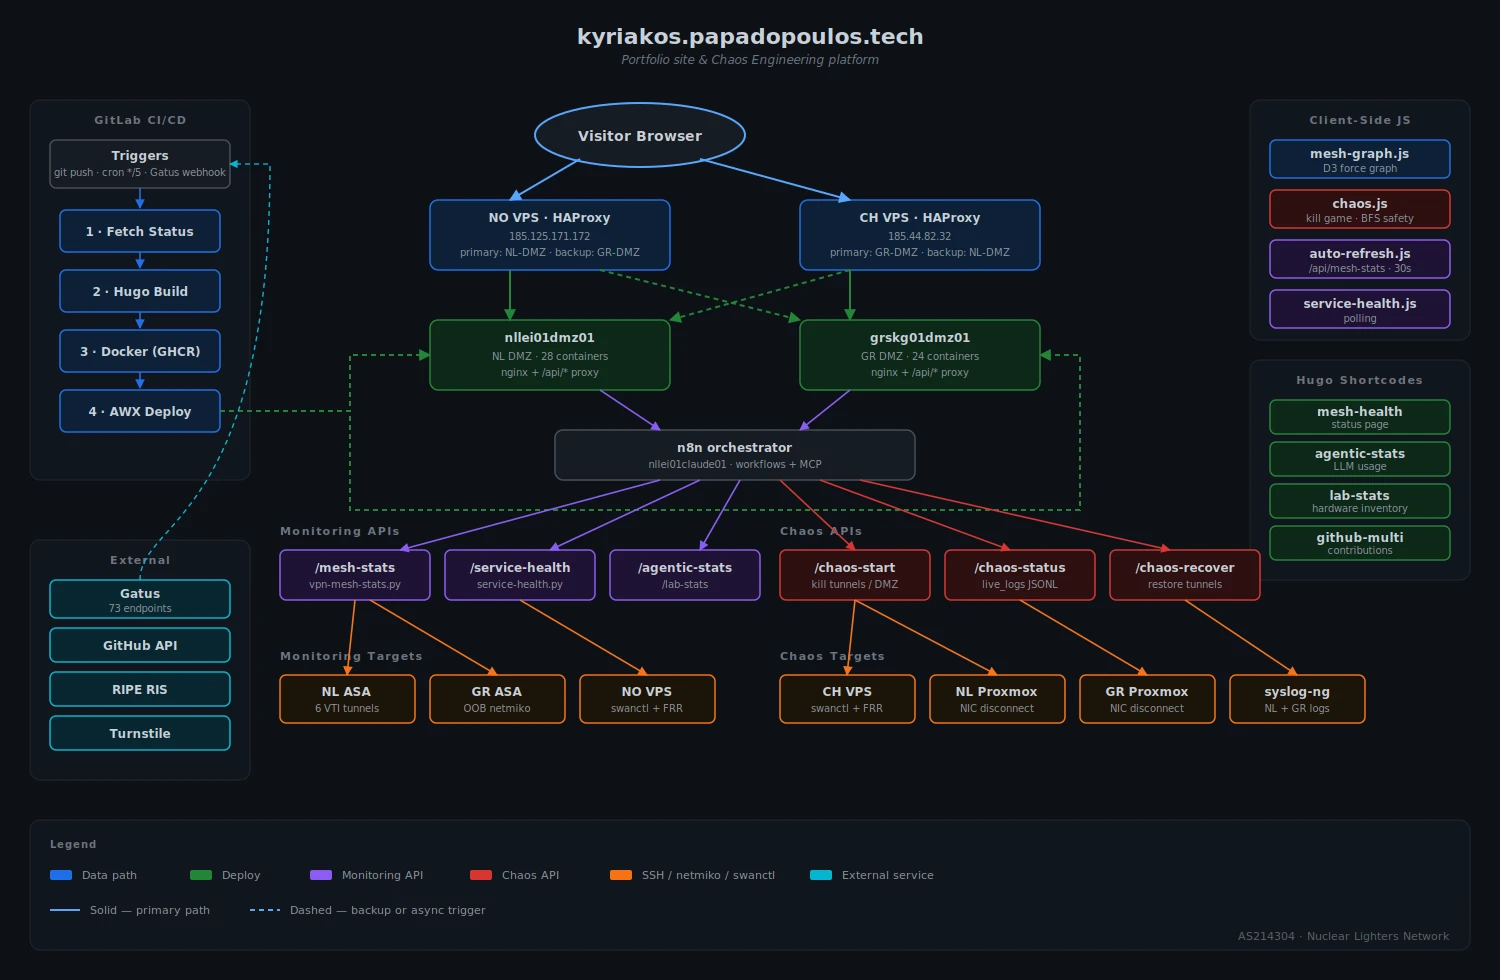
The site is a Hugo static build (PaperMod theme, dark mode) that gets baked into an nginx Docker image and deployed to DMZ hosts on both sites. The chaos game is a separate system: ~4000 lines of Python (chaos-test.py, chaos_baseline.py) orchestrated by n8n webhooks, with a ~1100 line JavaScript frontend (chaos.js) and a ~1450 line D3 graph (mesh-graph.js).
Browser → VPS HAProxy → DMZ nginx → /api/* → n8n → SSH → chaos-test.py → ASA/VPS
HAProxy on each VPS has the local DMZ as primary and the cross-site DMZ as backup (health checks: inter 2s fall 2 rise 1). When a DMZ goes down, HAProxy detects it in ~4 seconds and switches. The recovery path for GR ASA tunnels uses an OOB internet path (port 2222 on the GR public IP → netmiko) so recovery commands work even when all VPN tunnels are killed.
CI runs a 4-stage pipeline on push or every 5 minutes: fetch live data from n8n webhooks, Hugo build, Docker push to GHCR, AWX deploy to both DMZ hosts. The status page data is baked for instant first paint, but volatile fields (tunnel status, BGP counts, the compound status banner) are always fetched from the live API – a lesson learned after CI captured a chaos test mid-flight and baked “Critical” status into the static HTML.
What Breaks
The NO-CH VPS tunnel (swanctl) has a recovery bug where the IKE SA gets terminated but not re-initiated, requiring a manual swanctl --load-all && --initiate. I’ve fixed this twice and it keeps coming back because the sudo password gets consumed by the first command in a pipe chain. The current fix uses sudo -S bash -c '...' to run everything under one sudo session.
HAProxy on the CH VPS returns 429 rate limit errors during chaos tests because the browser polls the status API every 2 seconds and each request goes through the portfolio backend. The n8n webhook can handle it, but HAProxy’s per-backend connection limits throttle the response.
The syslog time filter uses awk '$3 >= t' which only works for same-day queries. A chaos test that starts at 23:58 and runs past midnight would miss the post-midnight log entries.
Yes, this is a portfolio site where visitors can kill production VPN tunnels on real Cisco ASA firewalls and watch BGP failover happen in a terminal. The infrastructure recovers automatically. Usually.